Answers to Problems
Easy:
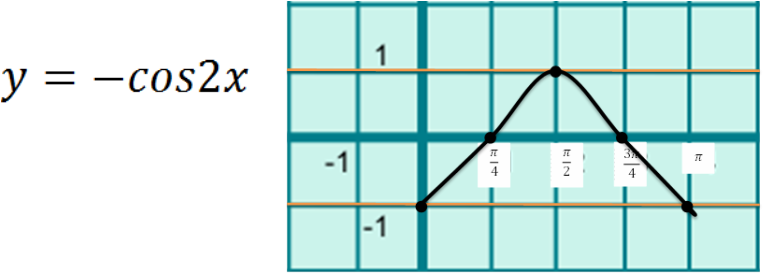
First, you need to realize that this graph is a cosine graph. Also you need to realize that it is negative. Just like the first two, you need to find the period. You always have to find the period for any graph, that way you know where you are going on the graph. First, you put 2pi over B, which is 2. The two's cancel out, leaving you with pi. Then, like always, you find the intervals. You put pi/4 and you get your intervals by going pi/4 until you get to pi. The amplitude is 1, so once again you would go up one and down one from zero. Since the equation is negative, a regular cos graph will be turned upside down, with the first point at (0,-1). Just like a regular cosine graph, you would follow the intervals and your points would be (pi/4,0), (2pi/4,1), (3pi/4,0), and (pi,-1). When you put all of the points together and put lines between them, you get your cosine graph.
Medium:
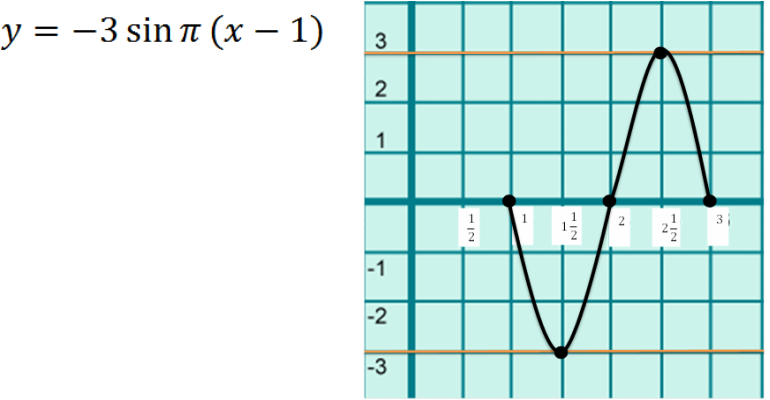
This graph is alot like the others, but there are some differences and they will matter. First, though, we will look at what kind of graph it is. When we look at the equation, we see that it is a sine graph and that it also negative. That means that we will turn a regular sine graph upside down. The next thing we do, like always, is find the period. By now, we are all probably pros at this, but we have to find it still. We put 2pi/pi and try to cancel. The two pi's can cancel out leaving you with your period, which is 2. So now that we know the period, we have to find the intervals. We put 2/4, which reduces to 1/2. Your intervals will now be going up by 1/2. In the past two problems, the equations have had a +1 at the end, but this one doesn't. That means that the sinusodial axis will be at zero since D is 0. When there is nothing at the end of the equation, assume that it is 0. Next we see that there is a 3 in front of the sin, which is the amplitude. This means that we will go up 3 and down 3 from zero. Next thing that we do is look to see if there are parenthesis, which there is. In the parenthesis is -1. This means that all of the dots will be moved to the right by 1. So this means that where the dot (0,0) would have been, it is now at (1,0). Now that that dot has moved, that means that all of the other points will be moved over. Now all of the dots are at (3/2,-3), (2,0), (5/2,3), and (3,0).
Hard:
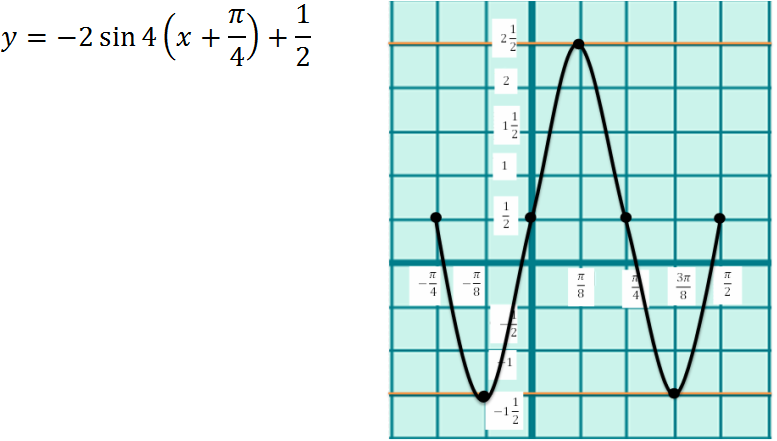
First we need look at the equation and see what we need to do. We see that there will an amplitude, a period that is not 2pi, a transformation, and a sinusodial axis that is not zero. Now that we know all of these, we can draw the graph. If we look at the equation, we can see that it is a sine graph and that it is going to be negative. Because it is negative, all of the points will be flipped on an original sine graph and so will ours. Next, we have to find the period. Since there is a 4 and not a 1 before the x, that means that our period will not be 2pi, but 2pi/4. Since both the top and bottom can be divided by 2, we are left with our period which is pi/2. Now that we know our period, we need to find our intervals. We put pi/2/4 and F&M. We will multiply pi/2 by 1/4 and we will get our interval, which is pi/8. Since we know both the period and the intervals we can find the sinusodial axis. If we look at the end of he equation, we have a D. Since the D is 1/2, that means that our first, third, and last points will be on that line. Next we have to find the amplitude. There is a 2 at the beginning, so that means that we will go up two and down two from 1/2. This means that our points will be around 2 and 1/2, 1/2, and -1 and 1/2. Next, we have to find the transformation. In the parenthesis, along with the x, is a +pi/4. This means that all of the points will be moved to the left pi/4. This means that where the original point (0,1/2), it is now at (-pi/4, 1/2). Now we can change the rest of the points, which are (-pi/8,-3/2), (0,1/2), (pi/8, 5/2), (pi/4, 1/2), (3pi/8, -3/2), and the last point is at (pi/2,1/2).
Application:
A tsunami approaches the San Francisco Bay. The water first goes down from its normal level, then rises and equal distance above its normal level, and finally returns to its normal level. The tsunami that is approaching has an amplitude of 12 meters. The period is about 15 minutes. The normal depth of water at San Francisco Bay is 12 meters. Draw a graph and write a function.
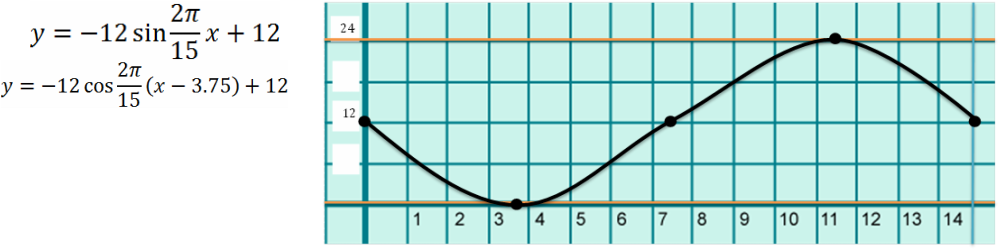
This problem is just like the other application problems, but the only difference are the numbers. It says that the normal depth of the water is 12 meters and that when the tsunami hits, the water goes under the normal depth, then above the normal depth, and then back to the normal depth of the water. Since we know that when no time has passed, the water is still at 12 meters, so our first point is at (0,12). The next thing that we learn in the problem is that the amplitude of the tsunami is 12, so that means we will go up 12 from the normal depth of the water to 24 meters and down 12 from the normal depth of the water to 0. Because we know this, we also know that our mid points will be on 12, since that is between 0 and 24 exactly. The next thing that the application tells us, is that the tsunami takes 15 minutes. That is also our period. So we know that our points will be between 0 and 15 for one full period. Since we also know that we can plot the very last point, which is (15,12). Now that we know our first and last points, we have to find the middle points. We find that by subtracting 15 from 0, giving us 15. We then divide that by 2, to find that our middle point will be after 7.5 minutes. Now that we know that and also that middle points go on the sinusodial axis, we can tell that the point is at (7.5,12). Now that we have the three middle points, we have to find the high and low points. Since the low point occurs first, according to the problem, then we will find that first. We subtract 7.5 from 0 and get 7.5. To find the low point, we divide 7.5 by 2 and get 3.75. Since we can not go lower than 0, we know that our low point is at the coordinates (3.75,0). Now to find the high point, we subtract 15 from 7.5 and we get 7.5. Now we divide that answer by 2 and get 3.75 again. So we add 3.75 to 7.5 in order to get 11.25. Siince the highest we can go is 24, we know that the point will be at (11.25,24). Now that you have all the points, plot them and draw the lines in order to get your graph. But we are not done yet. The problem asks us to find equations. Well since we know the amplitude (12), the period (15), and the sinusodial axis (12). Now we need to see if there is a transformation. Out of any graph, you can make a cosine and a sine equation. If we look to see where the sine graph starts we see that it was moved none, but we also see that it is negative since it goes down and not up first. If you look for a cosine graph, you see that it is moved to the right by 3.75 and that it is negative as well, since it starts with a maximum and not a minimum. Now we can write the equation. Amplitude is first, then sine or cosine, then B, which you get by doing 2pi/15 (period), which can not reduce, then it is the parenthesis with the transformation, and then last but not least is the sinusodial axis. The amplitude, B, and the sinusodial axis is the same for both a cosine and sine equation. The only difference is the transformation. Now that we know that, lets write the equations. The sine equation is y=-12sin(2pi/15)x+12 and the cosine equation is y=-12cos(2pi/15)(x-3.75)+12. If you got those and the graph, then you did what the problem asked you to do.
Other Websites for help:
http://www.intmath.com/trigonometric-graphs/1-graphs-sine-cosine-amplitude.php
http://homepage.mac.com/shelleywalsh/MathArt/GraphingSinCos.html
http://homepage.mac.com/shelleywalsh/MathArt/GraphingSinCos.html
Work Cited:
Worksheets (trig graphs #1), practice quizzes, and packets (sinusodial functions as mathmatical models: ws 1) that we got in class that were handed out during this unit.
