Medium Difficulty Problems
Number One


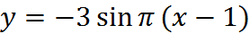
Well, this is different from the easy problems. There are numbers in parethesis and numbers outside of them. Well, we will get through it. It may seem a little hard, but you will soon learn that it actually is not. First off, it still looks like an actual sine graph. The only difference is that it is moved up and over. At the end of the equation you realize that there is a plus 1. That is is the sinusodial axis (also known as a vertical shift), or D. When you have D at the end, you will base your amplitude off of that number. So once again, the amplitude of this graph is 1. Next, you will draw a dotted line on 1. Because the amplitude is 1, you go up one from the sinusodial axis to 2 and down one from the sinusodial to 0. Now, you have the three lines that you will place your dots. Finding the period does not change. You do the same thing that you did for the easy problems. You out 2pi/B, which in this case is 1. Because 2pi/1 is still 2pi, then that is your period. You also find the intervals the same way. You get 2pi/4, which reduces to pi/2, so you will go up in that interval until you reach 2pi. Next thing is the parenthesis. When you have something in the parenthesis other than x, that means that will be a transformation, either to the left or to the right. It will go right when it is -, and it will go to the left when it is +, but only when it is in the parenthesis is when you have a horizontal transformation. Also the number other than x is called C. In this equation, inside the parenthesis is -pi/4. This means that you will move every dot right pi/4. What helps me usually, and might help you, is to draw the first equation and then draw the transformation. If you need to rewrite your intervals into fourths, you can. Pi/4 is half of pi/2, so if you put slashes between the intervals you already have then thats fine. Originally, your first point would be at (0,1), but because of the transformation, it is now at (pi/4,1). You do this with all of your points, so now your points are at (3pi/4, 2), (5pi/4, 1), (7pi/4,0), and at (9pi/4,1). It was sort of hard, but if you follow those directions, then you should be fine.
Number Two
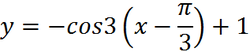

This graph is just like the graph of the first one, but it now has a number before the parenthesis, but we will get to that a little later. First, we need to realize that this is a cosine graph and that it is also negative. That means that it will be like a cosine graph, just upside down. Just like the first graph, and all of the others that were on the easy page, you have to find the period. Its the basis for all graphs. 2pi/B, which is 3 in this case, will end up being your period. Next, are the intervals. We put 2pi/3/4 and F&M, which we learned how to do in the easy problems. The 4 turns into 1/4 and now you multiply 2pi/3 and 1/4, giving you 2pi/12. You can divide both the top and bottom by 2 and your intervals are now going up by pi/6. You plot your intervals and then you look back at your equation. You realize that it also has a D just like the first one. The D in this equation is 1, so that means that the sinusodial axis will be at 1. You will go up one and down one from the sinusodial axis leaving you with where your points will be on the lines,at 0,1, and 2. The next thing that we realize is that there is a -pi/3. This means that where the point (0,0) would be is now at (pi/3,0). All of the points that were are now moved to the right pi/3. Now all the points are at (pi/2,1), (2pi/3,2), (5pi/6, 1), and (pi,0).
You Try: